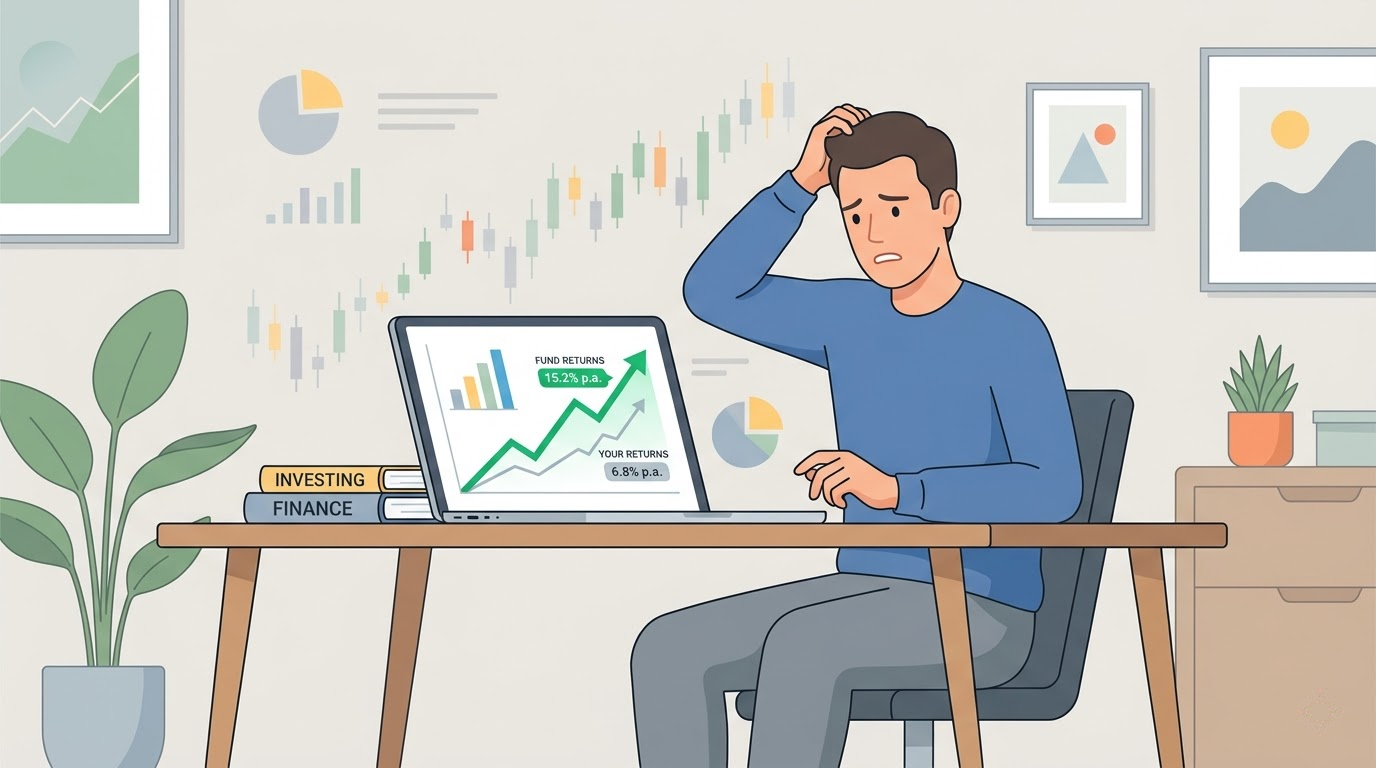
If you’re opening your Zerodha or Groww app every morning before chai, you might be your own worst enemy. Science says so, and the data is pretty clear.
India’s retail investor base has exploded. Over 15 crore demat accounts are now active, and with real-time dashboards at our fingertips, checking the portfolio has become a reflex. Red day on the Sensex? We check. RBI announcement? We check. Bored on the metro? We check. But here’s the uncomfortable truth: the more you look, the more likely you are to lose.
The Brain Trap: Myopic Loss Aversion
Economists Daniel Kahneman and Amos Tversky identified a psychological bias called Myopic Loss Aversion. This is the tendency to feel the pain of a loss roughly twice as intensely as the pleasure of an equivalent gain.
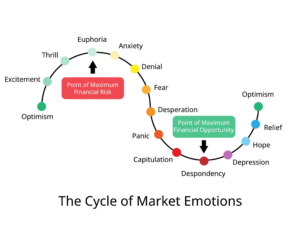
When you check your portfolio daily, you are statistically guaranteed to see “red” numbers frequently. Your brain reacts disproportionately to these minor dips, leading to:
- Panic Selling: Exiting a great fund during a temporary market breather.
- Over-Trading: Attempting to “fix” a portfolio that isn’t broken.
- Lower Risk Appetite: Frequent feedback makes investors too cautious, causing them to miss out on the equity risk premium.
What the Data Actually Shows
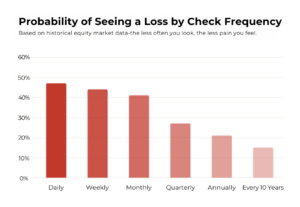
The odds of witnessing a loss shrink dramatically the less frequently you look. Markets are volatile in the short run (noise), but they trend upward over time (signal).
- Daily Checkers: You are essentially flipping a coin. The probability of seeing a gain vs. a loss is nearly 50/50.
- Annual Checkers: The probability of seeing a positive number jumps significantly.
- The “Dead Investor” Theory: A famous internal study by Fidelity reportedly found that their best-performing accounts belonged to investors who had either forgotten their passwords or had passed away. The common thread? Zero meddling.
What This Means for Indian Investors
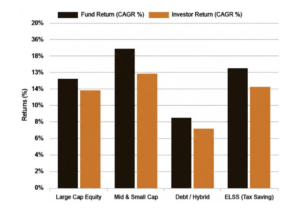
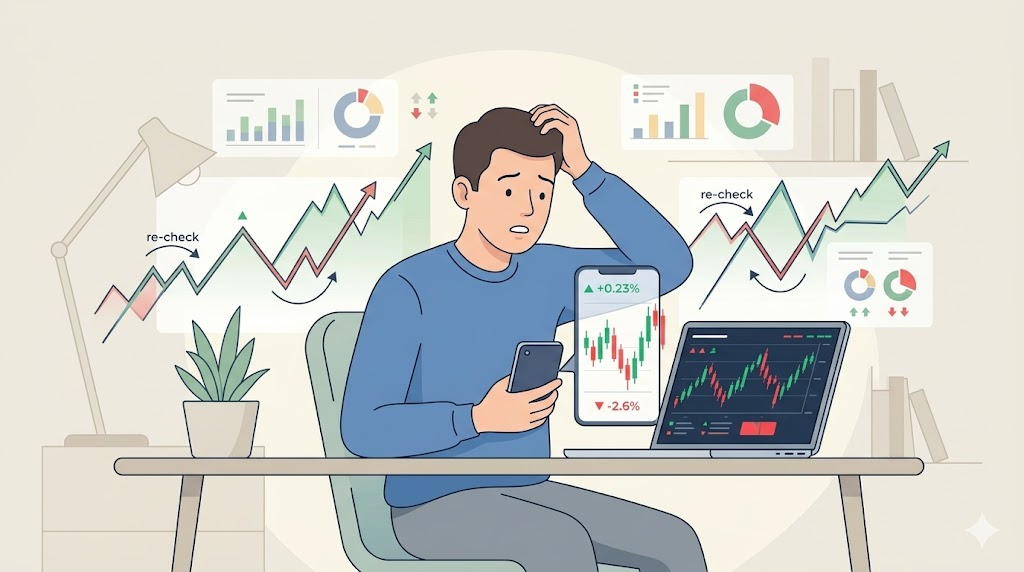
The Indian market context makes this even more relevant. The Nifty 50 has delivered roughly 12–14% annualised returns over the long term, but only to those who stayed invested. The typical retail investor, spooked by volatility, tends to exit at lows and re-enter at highs, systematically underperforming the index they could have just held.
SIP investors in Indian mutual funds who stayed the course through COVID-19, Budget volatility, and global rate cycles have largely come out ahead. Those who tinkered with checking daily and reacting emotionally often did not.
So, How Often Should You Check?
For most investors, a quarterly review is the “sweet spot.” Use this time to:
- Ensure your asset allocation hasn’t drifted too far (e.g., from 70% equity to 85%).
- Confirm your SIPs are processing correctly.
- Verify there are no major structural changes in your core fund holdings.
Beyond that, close the app. If you are a long-term mutual fund investor, even an annual review is perfectly sufficient, and frankly, much healthier for your mental well-being.
The best investment habit you can build in 2026 isn’t a new stock-picking strategy; it’s the discipline to look away. Set price alerts for extreme moves if you must, but otherwise, let compounding do its quiet, patient work.
Frequently Asked Questions
- Why does checking my portfolio daily lead to losses?
It triggers emotional reactions to short-term volatility. When you see a dip, the “pain” of the loss often leads to impulsive decisions, like stopping an SIP or selling a quality fund, which disrupts compounding. - Is a quarterly review enough to catch a market crash?
Yes. Market crashes are part of the equity journey. Since you cannot predict them, checking daily doesn’t help you avoid them, it only increases the chance that you will panic-sell at the bottom. - What should I do if I see a 10% dip during my quarterly review?
Check if the fundamentals of your investments have changed. If the dip is due to general market sentiment (like an RBI rate hike or global cues), the best move is usually to do nothing and let your SIPs continue. - Won’t I miss out on “buying the dip” if I don’t check daily?
You can set automated price alerts (e.g., if the Nifty drops 5%) instead of manually checking every day. This allows you to act on opportunities without being consumed by daily noise.