The Narrative Fallacy: When Stories Mislead Investors

A compelling story, about a visionary founder or a revolutionary technology, can make any investment feel like a total sure thing. Humans are hardwired to think in narratives, not numbers.

The Narrative Fallacy occurs when we latch onto a neat storyline, completely ignoring cold hard data and probability. The key to long-term wealth preservation is recognizing when a good story is replacing your fundamental analysis entirely.

Introducing the Story-vs-Data Framework

A Story-vs-Data Framework forces you to separate emotional conviction from statistical evidence before deploying your capital.

This approach requires writing down the exact narrative driving your interest and stress-testing it against hard financial metrics. It ensures that you never invest blind faith into a beautifully told fiction.

How the Framework Works

To separate hype from genuine market opportunity, evaluate your potential investments across four structured steps:

  • Identify the Narrative: Write down the exact story attracting you in one clear sentence. If it sounds vague, overly optimistic, or purely emotional, refine it.
  • Gather Opposing Data: Actively search for earnings reports, valuation multiples, profit margins, debt ratios, and industry data that directly contradict the story.
  • Assign Probabilities: Estimate realistic odds of the narrative playing out as envisioned. Most high-hype stories sit around a modest 20–40% success probability.
  • Set Kill Criteria: Explicitly define the specific metrics that would prove your initial story wrong, and commit to exiting the trade before emotions interfere.

Benefits of the Story-vs-Data Approach

By establishing an institutional testing mechanism, you protect your portfolio from psychological traps:

  1. Reduces Emotional Attachment: It stops you from holding onto positions that feel “obvious” but completely lack fundamental evidence.
  2. Mitigates Concentration Risk: It prevents you from making destructive “all-in” bets on a single hyped theme.
  3. Encourages Intellectual Honesty: It enforces a disciplined, objective approach to portfolio construction.
  4. Filters Out Hype: It helps you clearly distinguish between genuine structural insight and crowd-sourced hype disguised as high conviction.

The Bottom Line

Stories are how markets create massive speculative bubbles and how investors justify holding assets through catastrophic collapses:

  • The dot-com boom was driven by “the internet changes everything.”
  • The 2008 crash was fueled by “housing prices never fall.”
  • Every single market cycle comes with its own irresistible, seductive narrative.

A Story-vs-Data Framework provides a structured, repeatable method to channel your curiosity into rigorous analysis, balancing narrative intuition with statistical discipline and risk management.

A narrative can be a powerful lens for spotting opportunities early, but its impact depends entirely on how you deploy it. By using this framework, you harness the power of storytelling without becoming its victim, preserving your capital and your ability to think clearly when everyone around you is intoxicated by the plot.

Remember: The most expensive words in investing are “This time it’s different.” The story may change every cycle, but the math never lies.

Frequently Asked Questions

  1. What is the Narrative Fallacy in stock market investing?
    It is a cognitive bias where investors latch onto a compelling, easy-to-understand storyline about a company or industry while ignoring conflicting financial data, historical odds, and valuation metrics.
  2. Why do great stories in investing lead to market bubbles?
    Stories appeal to human emotions, making complex financial realities seem simple and guaranteed. This creates widespread enthusiasm (FOMO), driving asset prices far above their actual fundamental values until the bubble bursts.
  3. How does the “Kill Criteria” protect an investor from losses?
    Kill Criteria are pre-determined financial triggers (like a drop in profit margins or a rise in debt) that signal a story is failing. Defining them in advance forces an objective exit before emotional attachment sets in.
  4. What is the difference between a market narrative and a fundamental catalyst?
    A narrative is a qualitative idea based on potential or hype. A fundamental catalyst is backed by verifiable data, such as expanding profit margins, rising revenue growth, or debt reduction, that directly impacts valuation.


Why Your Brain Makes You Buy High and Sell Low

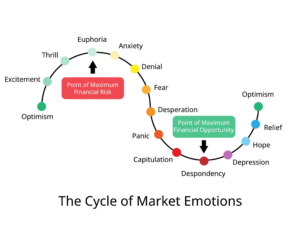
Every market crash follows a cruel, predictable pattern: ordinary investors panic-sell after steep falls, locking in permanent losses, and then rush back in near the market peak, chasing gains that have already been made.

This isn’t stupidity, it’s biology. Your brain evolved to keep you alive on the savannah, not to navigate volatile stock markets. The exact same survival instincts that once saved your ancestors from predators now actively sabotage your portfolio. Understanding these subconscious mental traps is the essential first step toward breaking free from them and building lasting, generational wealth.

Your wealth has a choice, every single day.

The Science Behind Panic Selling

Your amygdala, the brain’s primal threat-detection centre, processes fear and panic far faster than your rational prefrontal cortex can step in to intervene. When markets plunge, your brain interprets falling portfolio values the exact same way it would treat a charging tiger: run now, think later.

Three key psychological biases drive this destructive behaviour:

  • Loss Aversion: The psychological pain of a loss feels roughly 2× more intense than the pleasure of an equivalent financial gain.
  • Recency Bias: Your brain assumes recent short-term market crashes are permanent, projecting current pain far into the future.
  • Herd Instinct: Social safety mechanisms make us believe that if everyone else is panicking and selling, it “must” be the right move.

Long-term research by Dalbar Inc. proves this damage: over a 30-year period, the average equity investor earned just 3.6% annualized, while the S&P 500 returned 10.7%. This massive gap was caused almost entirely by poorly timed entries and panic exits.

Why We Chase the Top

Euphoria at the top of a market cycle is just as dangerous as panic at the bottom. When stock prices surge, dopamine floods your brain, the exact same chemical triggered by gambling wins.

Rising prices create an overwhelming Fear of Missing Out (FOMO) that completely overrides rational caution:

  • Media headlines celebrate record-breaking market highs.
  • Social gatherings buzz with stories of quick, overnight gains.
  • Sitting quietly on the sidelines suddenly feels like losing money.

Your brain confuses “this feels exciting” with “this is a good financial decision.” By the time greed convinces you to buy, the smart money has already moved on, leaving you holding overpriced assets right before a correction.

“The time of maximum pessimism is the best time to buy, and the time of maximum optimism is the best time to sell.” –  Sir John Templeton

How to Rewire Your Instincts

The antidote to hardwired biological impulses isn’t willpower, it’s systems. To protect your capital from your own mind, build structural defenses:

  1. Automate Investments: Use Systematic Investment Plans (SIPs) or automated recurring purchases so buying decisions happen smoothly without emotional friction.
  2. Write an Investment Policy Statement (IPS): Draft a rules-based document when you are calm, outlining explicit action steps during crashes. This acts as your personal “pre-commitment device.”
  3. Reduce Monitoring Frequency: Limit how often you check your portfolio. Daily screen monitoring amplifies anxiety without adding a single bit of useful information.
  4. Diversify Broadly: Ensure no single holding or sector can trigger a full-blown panic response.
  5. Study Market History: Remind yourself that every single crash in market history has eventually been followed by a recovery, a fact your amygdala conveniently ignores during a sell-off.

The Bottom Line

Your brain’s survival wiring makes you a naturally terrible market timer. Loss aversion drives you to sell low during crashes, while dopamine-fueled FOMO pushes you to buy high during peaks. The massive gap between investor returns and market returns proves this isn’t just theory, it costs real, hard-earned money.

By building automated systems, pre-committing to a written strategy, and recognizing your cognitive traps, you can turn your worst biological instincts into your greatest market advantage. The goal isn’t to feel zero emotion; it’s to act strictly on logic when your emotions are screaming otherwise.

Frequently Asked Questions

  1. Why does my brain react so emotionally to market crashes?
    Market drops trigger the amygdala, the brain’s threat-detection center. It interprets financial loss as a physical threat to your survival, triggering a “fight or flight” response before your rational mind can process the data.
  2. What is Loss Aversion and how does it hurt my investments?
    Loss Aversion is a behavioral bias where the psychological pain of losing money is twice as powerful as the joy of gaining it. This causes investors to panic-sell at the bottom just to stop the immediate “pain” of a falling portfolio.
  3. What is an Investment Policy Statement (IPS) and how does it help?
    An IPS is a written set of rules created when you are emotionally calm. It specifies exactly how you will handle market downturns, rebalancing, and asset allocation, serving as a pre-commitment tool to stop panic selling.
  4. How do SIPs help combat emotional investing biases?
    Systematic Investment Plans (SIPs) automate the buying process completely. By removing the manual decision-making step each month, SIPs bypass the emotional traps of fear and greed, using rupee-cost averaging to buy more units during dips.

When Should You Stop Checking Your Portfolio?

If you’re opening your Zerodha or Groww app every morning before chai, you might be your own worst enemy. Science says so, and the data is pretty clear.

India’s retail investor base has exploded. Over 15 crore demat accounts are now active, and with real-time dashboards at our fingertips, checking the portfolio has become a reflex. Red day on the Sensex? We check. RBI announcement? We check. Bored on the metro? We check. But here’s the uncomfortable truth: the more you look, the more likely you are to lose.

The Brain Trap: Myopic Loss Aversion

Economists Daniel Kahneman and Amos Tversky identified a psychological bias called Myopic Loss Aversion. This is the tendency to feel the pain of a loss roughly twice as intensely as the pleasure of an equivalent gain.

When you check your portfolio daily, you are statistically guaranteed to see “red” numbers frequently. Your brain reacts disproportionately to these minor dips, leading to:

  • Panic Selling: Exiting a great fund during a temporary market breather.
  • Over-Trading: Attempting to “fix” a portfolio that isn’t broken.
  • Lower Risk Appetite: Frequent feedback makes investors too cautious, causing them to miss out on the equity risk premium.

What the Data Actually Shows

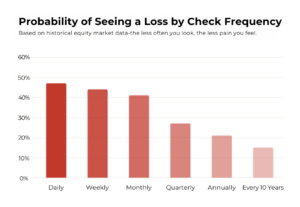
The odds of witnessing a loss shrink dramatically the less frequently you look. Markets are volatile in the short run (noise), but they trend upward over time (signal).

  • Daily Checkers: You are essentially flipping a coin. The probability of seeing a gain vs. a loss is nearly 50/50.
  • Annual Checkers: The probability of seeing a positive number jumps significantly.
  • The “Dead Investor” Theory: A famous internal study by Fidelity reportedly found that their best-performing accounts belonged to investors who had either forgotten their passwords or had passed away. The common thread? Zero meddling.

What This Means for Indian Investors

The Indian market context makes this even more relevant. The Nifty 50 has delivered roughly 12–14% annualised returns over the long term, but only to those who stayed invested. The typical retail investor, spooked by volatility, tends to exit at lows and re-enter at highs, systematically underperforming the index they could have just held.

SIP investors in Indian mutual funds who stayed the course through COVID-19, Budget volatility, and global rate cycles have largely come out ahead. Those who tinkered with checking daily and reacting emotionally often did not.

So, How Often Should You Check?

For most investors, a quarterly review is the “sweet spot.” Use this time to:

  • Ensure your asset allocation hasn’t drifted too far (e.g., from 70% equity to 85%).
  • Confirm your SIPs are processing correctly.
  • Verify there are no major structural changes in your core fund holdings.

Beyond that, close the app. If you are a long-term mutual fund investor, even an annual review is perfectly sufficient, and frankly, much healthier for your mental well-being.

The best investment habit you can build in 2026 isn’t a new stock-picking strategy; it’s the discipline to look away. Set price alerts for extreme moves if you must, but otherwise, let compounding do its quiet, patient work.

Frequently Asked Questions

  1. Why does checking my portfolio daily lead to losses?
    It triggers emotional reactions to short-term volatility. When you see a dip, the “pain” of the loss often leads to impulsive decisions, like stopping an SIP or selling a quality fund, which disrupts compounding.
  2. Is a quarterly review enough to catch a market crash?
    Yes. Market crashes are part of the equity journey. Since you cannot predict them, checking daily doesn’t help you avoid them, it only increases the chance that you will panic-sell at the bottom.
  3. What should I do if I see a 10% dip during my quarterly review?
    Check if the fundamentals of your investments have changed. If the dip is due to general market sentiment (like an RBI rate hike or global cues), the best move is usually to do nothing and let your SIPs continue.
  4. Won’t I miss out on “buying the dip” if I don’t check daily?
    You can set automated price alerts (e.g., if the Nifty drops 5%) instead of manually checking every day. This allows you to act on opportunities without being consumed by daily noise.

Diversification Is Boring: That’s Why It Works

There’s a certain thrill to going “all-in.” When a friend swears by a single mid-cap pharma stock or a cousin doubles his money on a trendy sectoral fund, diversification sounds like the advice a cautious uncle gives at a wedding – sensible, forgettable, and very easy to ignore. However, in the high-stakes world of Indian equities, “boring” is often the engine of sustainable wealth.

Source: NSE/BSE historical data

The Concentration Trap

India’s equity markets have minted legends. But for every Infosys that turned a ₹10,000 SIP into a crore, there’s an ADAG group, a Yes Bank, a DHFL stock that looked invincible right until they weren’t. Concentration risk isn’t theory; it’s the graveyard behind every bull-market brag.

Diversification doesn’t ask you to predict the next winner. It asks you to own enough of the market that when one sector stumbles, the rest keep walking.

What the Numbers Actually Say

Over a typical 10-year period, a diversified Indian equity portfolio blending large caps, mid caps, and some international exposure has historically experienced lower peak-to-trough drawdowns than concentrated sector bets, even when those bets outperform in a good year.

The chart makes the case plainly. A 65% drawdown requires a 186% gain just to break even. A 42% drawdown? You need 72%. The math of losses is crueller than it looks, and diversification simply reduces the hole you have to climb out of.

The Indian Context: More Reasons to Spread Out

Indian retail investors face unique temptations: thematic funds, SME IPOs, and unregulated “tips” from social media groups. We saw this play out during the 2017-18 mid-cap boom, followed by a brutal three-year correction that evaporated wealth built over a decade.

A truly “boring” but effective strategy includes:

  • Asset Diversification: A mix of Large-cap index funds, Flexi-cap funds, and Short-duration debt.
  • Gold & International: Adding a small slice of gold or global equities to hedge against domestic volatility.
  • Time Diversification: Using SIPs to invest steadily across cycles, buying more units when prices fall and fewer when they rise.

Beware of “Di-worsification”

There is one trap to watch out for: owning 14 different mutual funds that all hold the same 30 large-cap stocks. More funds do not necessarily mean more diversification.

If your multi-cap fund and your large-cap fund have a 70% portfolio overlap, you aren’t diversified, you are simply paying two different expense ratios for the same underlying stocks. Always check for correlation to ensure your diversification is meaningful.

The Bottom Line

The goal of investing isn’t to have the best story at a dinner party. It’s to have money when you need it. Diversification won’t make you the most exciting investor in the room, but it’s the one strategy that has quietly and consistently delivered for patient investors across every market cycle.

Frequently Asked Questions

  1. Does diversification mean I will never see a loss in my portfolio?
    No. Diversification doesn’t eliminate market risk, but it significantly reduces “idiosyncratic risk”, the risk of a single company or sector crashing and taking your entire portfolio down with it.
  2. How many mutual funds are enough for a diversified portfolio?
    For most retail investors, 3 to 5 well-chosen funds (covering different market caps and asset classes) are sufficient. Owning too many funds leads to “clapping the market” and higher costs.
  3. Why should I invest in “boring” Large-caps when Mid-caps give higher returns?
    Mid-caps offer growth, but Large-caps provide stability. During market downturns, Large-caps typically fall less, protecting your capital so you have a larger base when the market eventually recovers.
  4. What is portfolio overlap and why does it matter?
    Overlap happens when different funds own the same stocks. If you have high overlap, you aren’t actually spreading your risk; you’re just duplicating your bets and paying extra fees for it.

The Hidden Cost of “Waiting for the Right Time” to Invest

The Myth of the Perfect Entry Point

No one, not fund managers, not analysts, not the sharpest minds on Dalal Street, can consistently predict market bottoms. Lows are only obvious in hindsight. By the time you feel “safe” to invest, the recovery has already begun, and you’ve missed the best gains.

A CRISIL study on Indian equity SIPs found the return difference between the “best” and “worst” day to start investing was just 0.8% over a decade. Obsessing over timing is almost entirely wasted energy. Meanwhile, your money sits in a savings account earning 6-7%, barely outpacing India’s ~6% inflation. Real return? Nearly zero.

What a Delay Actually Costs You

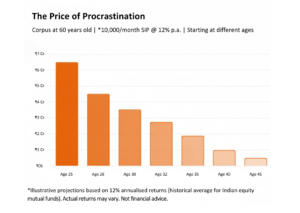
Timing isn’t just about missing a 5% dip; it’s about losing the most powerful force in finance: Compounding. Consider an investor putting ₹10,000 per month into an equity SIP with a 12% annual return, targeting retirement at age 60. Look at how the “Cost of Delay” compounds:

Start Age Monthly Investment Total Years Potential Wealth at 60
25 Years ₹10,000 35 Years ₹6.49 Crore
35 Years ₹10,000 25 Years ₹1.89 Crore
Difference 10 Year Delay ₹4.60 Crore Lost

The Impact: Waiting just a decade doesn’t just cost you 10 years of contributions; it can wipe out nearly ₹4.60 crore in potential terminal wealth. That is compounding working against you, not for you.

Why We Keep Waiting (and How to Stop)

Timing the market is deeply psychological. Financial news amplifies every market hiccup into a potential crash, making caution feel smart when it’s actually expensive.

Certified planners call this analysis paralysis one of the most common wealth destroyers among Indian investors.

The fix is a Systematic Investment Plan (SIP). Invest a fixed amount every month regardless of market levels, and you automatically buy more units when prices are low. Rupee-cost averaging removes the timing decision entirely. You don’t need to be right about the market, you just need to show up consistently.

Time in the Market Beats Timing the Market

India’s mutual fund industry crossed ₹66 lakh crore in AUM in 2025, with monthly SIP inflows consistently above ₹25,000 crore. The retail investors driving this aren’t timing markets, they’re trusting time. You don’t need the Sensex at a magic number. You just need to start. The “right time” you’ve been waiting for? It was yesterday. The second-best time is right now.

The Bottom Line

Markets will always find a reason to look scary: elections, inflation, geopolitical tensions. The noise never stops. But history is clear: investors who stay invested build wealth; those who wait on the sidelines watch it erode. Start your SIP today. Pick a date, any date. Stay invested. Let time do the heavy lifting. That’s not just a strategy. That’s the strategy.

Frequently Asked Questions

  1. Is it better to wait for a market crash to start an SIP?
    No. As the CRISIL study shows, the difference in long-term returns is negligible. Waiting for a crash often means missing out on months of growth that far outweigh the benefit of a slightly lower entry price.
  2. What is the “Cost of Delay”?
    It is the potential wealth lost by not allowing your money to compound. Because compounding is exponential, the “lost” returns from your final years are much larger than the principal you save by waiting.
  3. Does market timing work for long-term goals?
    Rarely. Even professional fund managers struggle with it. For goals like retirement or education, “Time in the market” is statistically proven to be more effective than “Timing the market.”
  4. What is the biggest psychological barrier to starting?
    “Analysis Paralysis.” News cycles make every economic event seem like a crisis. Professional planners suggest automating your first SIP to break the cycle of overthinking.

Why Most Investors Earn Less Than Their Mutual Funds

Your fund’s CAGR looks great on paper but how much of it did you actually pocket?

India’s mutual fund AUM crossed ₹66 lakh crore in 2025. Crores of investors track their returns with pride. Most are quietly earning far less than the fund delivered. Welcome to the Behaviour Gap.

The Gap Nobody Talks About

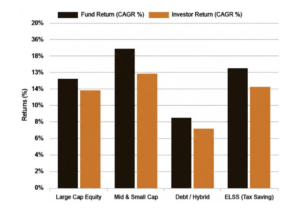
A fund’s “Total Return” (CAGR) shows what a lump sum would have grown to over time. However, Investor Return accounts for the timing of buys and sells.

  • The Reality: Globally, investors lose about 1–1.5% annually to poor timing.
  • The India Factor: In our volatile market, this gap is often much wider.
  • The Cause: We tend to pile into mid-cap rallies at the peak and panic-sell during corrections.

Why We Get in Our Own Way?

The culprit isn’t the market; it’s human psychology. Research shows a consistent, damaging pattern in Indian retail investing:

    • Performance Chasing: Inflows peak after a fund has already delivered massive 3-year returns.
    • Panic Redemptions: Outflows spike precisely when NAVs bottom out.
    • The Result: By buying high and selling low, investors hand back their compounding gains to the market.

“We tend to buy after a fund has had a good run and sell after it’s had a poor run. Human nature, being what it is.” — Russel Kinnel, Morningstar Director of Manager Research

SIPs: The Tool vs. The Discipline

Systematic Investment Plans (SIPs) are the best defense against emotional trading, but they aren’t foolproof.

  • The Strength: Rupee-cost averaging automatically buys more units when prices are low.
  • The Weakness: The strategy only works if you don’t interfere.
  • The Common Mistake: Many investors pause SIPs during “bad” markets or switch to last year’s top performer, triggering exit loads and taxes.

How to Close the Gap

To ensure you actually “pocket” the CAGR your fund promises, follow these guidelines:

  1. Automate & Evacuate: Start a SIP and stop checking the NAV daily.
  2. The Quarterly Rule: Review your portfolio once every three months—never during a market crash.
  3. Kill the Comparison: Don’t swap funds just because another category had a temporary “hot” streak.
  4. Goal-Based Exit: Define your target date and let compounding work undisturbed until you reach it.

India’s new investors have something previous generations didn’t: awareness. The behaviour gap is not a market problem; it’s a mindset one. The fund will deliver its returns. The only question is whether you’ll be patient enough to receive them.

Frequently Asked Questions

  1. What is the “Behaviour Gap” in mutual funds?
    The difference between the returns a fund generates and the actual returns an investor “pockets.” It is usually caused by emotional decisions like buying when the market is high and selling during a crash.
  2. Why are my actual returns lower than the fund’s CAGR?
    If you started your investment after a fund already performed well, or if you paused your SIP during a market dip, you likely missed the periods of highest growth, leading to a gap in performance.
  3. Can an SIP completely eliminate the Behaviour Gap?
    An SIP is a powerful tool for discipline, but it only works if you don’t interfere. Investors often “break” the SIP by stopping it during volatility or switching funds frequently, which restores the gap.
  4. How often should I monitor my mutual fund portfolio?
    To avoid emotional triggers, it is best to review your portfolio quarterly or even bi-annually. Frequent daily checks of the NAV often lead to “panic-selling” or “performance chasing.”


Why Smart Money Prefers Indirect Investing?

In India’s Demat Revolution, retail participation is at record highs, with over 200 million demat accounts and monthly SIP inflows of ₹28,000 crore. Yet a divide remains. While many investors chase multibaggers through direct stocks, smart money like institutions and seasoned HNIs increasingly prefers indirect investing via mutual funds and index funds. Here is why this backseat approach may be the smarter choice for your portfolio:

  • The “Skill vs. Luck” Ratio 
      • Most retail investors treat direct stocks as a hit-or miss game. Smart money focuses on probabilities, using data and research teams that retail investors cannot match. 
        • The Data: A 2025 SEBI report showed that over 85% of retail direct stock portfolios failed to beat the Nifty 50 over three years. Over the last five years, the Nifty 50 delivered annualised returns of around 12–13%, while top Flexi cap funds generated average annualised returns of 16.08% during the same period.
        • The Strategy: Instead of spending hours on individual stocks, delegate to professionals. The goal is not to be right once, but to build consistent wealth over a decade. 

  • Diversification as a Survival Shield 
      • New investors often fall in love with themes like green energy or AI and over-concentrate. Smart money understands that sector leadership in India keeps rotating. 
        • The Data: In late 2025, some small-cap indices delivered negative returns due to valuation bubbles, while diversified equity funds stayed resilient by spreading across 50 to 70 companies. 
        • The Strategy: Use indirect investing for instant diversification. If one sector slows, growth in others like banking or consumption helps protect capital. 
  • Avoiding “Tax & Transaction” Leakage 
      • Direct trading is costly. Frequent portfolio churn to book short-term profits leads to losses from brokerage, STT, and 15% STCG tax. 
        • The Quantitative Fix: Active traders often lose 2% to 4% of their potential corpus annually to taxes and costs. In mutual funds, rebalancing happens without triggering taxes. You pay tax only when you withdraw years later
  • Overcoming the Emotional “Panic” Trigger 
    • Direct investing is highly emotional. A 7% single day fall often triggers impulsive selling. Indirect investing creates psychological distance that supports discipline. 
      • The Data: AMFI research shows SIP investors hold investments three times longer than direct equity traders. This discipline has pushed retail investors to a record 44% share of equity fund assets. 

The Strategy: Automate discipline by avoiding daily buy-sell decisions to protect long-term compounding.

Conclusion

The shift toward indirect investing is not a sign of giving up. It reflects maturity. Smart money understands that in a fast-moving and complex economy, consistency matters more than intensity. By choosing the indirect route, investors gain professional management, diversification, and tax efficiency. As India moves toward Capital Markets 3.0, winners will not be those who find the next big idea once, but those who stay invested in the entire growth story through a disciplined indirect approach.

Frequently Asked Questions

  1. What is indirect investing?
    Indirect investing means investing through mutual funds or index funds instead of buying individual stocks directly.
  2. Why do many experienced investors prefer indirect investing?
    Indirect investing provides professional management and diversification, which can help improve long-term returns and reduce risk.
  3. How does indirect investing help with diversification?
    Mutual funds and index funds invest in many companies across sectors, reducing the risk of losses from a single stock.
  4. Is indirect investing more tax-efficient than direct trading?
    Yes. Mutual funds allow portfolio rebalancing without immediate taxes, while frequent stock trading can trigger brokerage costs and short-term capital gains tax.


Navigating Market Noise: 5 Common Investor Mistakes

Volatility is a feature of Indian equity markets, but sharp weekly moves of 2–3% in the Nifty 50 can unsettle even experienced retail investors. With retail participation at record highs and demat accounts crossing 200 million as of late 2025, avoiding behavioural mistakes is critical for protecting long-term wealth. Below are five common errors investors make during market turbulence.

  • Panic-Stopping SIPs 

      • When the market dips, the instinct is to sell and wait for things to settle before buying again. This behaviour often proves counterproductive, as it locks in losses instead of allowing portfolios time to recover. Historically, investors who continued their Systematic Investment Plans (SIPs) through volatile periods such as the 2020 crash or the 2022 rate hike cycle benefited from rupee cost averaging. 
      • The Data: Stopping an SIP during a 10% market correction can reduce your 10-year terminal wealth by nearly 15–20% due to the loss of “cheap” units accumulated during the dip. 
  • Revenge Trading in F&O 

      • New investors often try to “make back” spot market losses by pivoting to Futures & Options (F&O). This is a high-risk gamble. 
      • The Data: SEBI’s landmark study revealed that 9 out of 10 individual traders in the equity F&O segment incurred net losses, with an average loss of ₹1.1 Lakh per person. Volatility expands option premiums, making “guessing the bottom” an expensive mistake. 
  • Ignoring the “Cash is King” Rule 

      • Many new investors remain 100% deployed at all times. Without a cash buffer, you cannot capitalize on “discounts” during a correction. 
      • The Quantitative Fix: Maintaining a 5–10% cash/liquid fund tactical allocation allows you to deploy capital when the Nifty P/E ratio drops below its 10-year average (historically around 20x–22x), offering better Margin of Safety. 
  • Over-Concentration in Small-Caps 

      • During bull runs, small-caps offer multi-bagger returns, but they are the hardest hit during volatility. 
      • The Data: In a standard market correction, Small-cap indices often see drawdowns of 25–30%, while the Nifty 50 might only drop 10–12%. Over-leveraging in small-cap stocks without a Large-cap “anchor” leads to portfolio wipeouts. 
  • Anchoring to “All-Time Highs” 

    • New investors often refuse to sell a non-performing stock because they are waiting for it to return to its peak price. In a volatile market, some stocks may never recover to those levels. 
    • The Strategy: Instead of price anchoring, focus on earnings growth. If a company’s EPS (Earnings Per Share) is declining while volatility is increasing, holding on is a “sunk cost” fallacy.

Frequently Asked Questions

  1. Why should investors avoid stopping SIPs during market volatility?
    Stopping SIPs during a market dip can reduce long-term returns because investors miss the opportunity to buy units at lower prices.
  2. Why is revenge trading in F&O risky?
    Futures and Options are highly volatile, and many retail traders lose money trying to recover losses quickly through risky trades.
  3. Why is keeping some cash important for investors?
    A cash reserve allows investors to buy quality stocks or funds at lower prices during market corrections.
  4. Why is over-investing in small-cap stocks risky?
    Small-cap stocks can fall much more during market corrections, which can lead to larger portfolio losses if not balanced with large-cap investments.


Why America Wants Greenland: The $700 Billion Arctic Gamble

The Golden Dome: America’s Secret Defense Shield

As of January 2026, Greenland has moved from a remote Arctic territory to the center of a geopolitical standoff. The driver is the proposed Golden Dome, a multibillion dollar missile defense system designed to intercept hypersonic threats before reaching the U.S. Washington argues ownership improves efficiency, as space-based components are estimated to cost $542 billion. Greenland-based interceptors could reduce response times by nearly 40%.

The Geography of Survival

Greenland sits directly beneath the “Great Circle Route”, the shortest flight path for missiles from Russia or China targeting the U.S. East Coast. The Pituffik Space Base (formerly Thule) already operates the AN/FPS-132 radar, capable of detecting threats 3,000 miles into foreign territory. 

Ownership would allow installation of mid-course interceptors that destroy warheads far from American borders. The strategic advantage is undeniable: Greenland isn’t just land, it’s the ultimate defensive high ground.

Breaking China’s Rare Earth Stranglehold

Beyond defense, Greenland holds the world’s 8th largest reserves of rare earth elements, essential for fighter jets and electric vehicles. The Tanbreez mine in Southern Greenland contains about 28.2 million metric tons. China controls over 60% of global mining and 90% of processing. In June 2025, the U.S. EXIM Bank issued a $120 million loan to accelerate Tanbreez, aiming for a pilot facility by mid 2026. With global demand projected to rise 400% by 2030, Greenland offers strategic insurance for U.S. technology and defense.

The Ice Bunker Advantage

NASA’s 2025-26 radar scans revealed something extraordinary: Cold War-era tunnels from the secret “Project Iceworm” remain intact 30 meters below Greenland’s ice. These abandoned infrastructure networks, originally intended to hide 600 nuclear missiles in the 1960s, now offer natural, satellite proof storage for Golden Dome hardware. 

Modern technology makes “under-ice” infrastructure viable again, creating hardened bunkers that enemy surveillance cannot penetrate.

The $700 Billion Offer

As of January 2026, the U.S. has reportedly proposed a $700 billion purchase or association deal to Denmark, coupled with threats of 25% tariffs on Danish goods if negotiations stall. This figure represents roughly 50x Greenland’s annual GDP, a real estate offer designed to bypass European diplomatic resistance. 

The recent “Davos Framework” suggests that while outright purchase remains diplomatically complex, the U.S. is successfully leveraging economic might to secure “perpetual rights” to Greenland’s soil and minerals through infrastructure loans and security partnerships.

Investment Implications

For investors, the message is clear: the Arctic is the new Persian Gulf. Watch Arctic-focused mining explorers like Critical Metals Corp (CRTM). As the U.S. pushes for “mineral sovereignty,” early-stage projects in Southern Greenland could attract massive capital inflows backed by government guarantees.

The geopolitical reality is stark whether through a $700 billion deal or expanded NATO agreements, America intends to anchor the Golden Dome in Greenland’s ice, securing both its skies and the future of high-tech manufacturing. The new Cold War isn’t being fought in deserts, it’s being waged on ice.

Frequently Asked Questions

  1. Why does the United States want Greenland?
    The U.S. sees Greenland as strategically important for missile defense, Arctic military positioning, and access to valuable rare earth minerals.
  2. What is the Golden Dome defense system?
    Golden Dome is a proposed U.S. missile defense system designed to intercept hypersonic missiles before they reach American territory.
  3. Why are Greenland’s rare earth minerals important?
    Greenland has large reserves of rare earth elements used in defense technology, electronics, and electric vehicles, reducing dependence on China.
  4. What makes Greenland strategically important for global security?
    Greenland’s location along key Arctic routes makes it ideal for missile detection systems, military bases, and monitoring potential threats from rival nations.


The Psychology Behind Panic Selling And How To Avoid It

Why Indian Investors Press the ‘Sell’ Button in Fear

Panic selling comes from the brain’s fight or flight response. When the Sensex falls 1,000 points in a day, fear takes over and weakens rational thinking. Loss aversion makes a 10% portfolio fall feel disastrous, even if overall gains are 30%. Rajesh Kumar, a Mumbai-based software engineer, recalls March 2020, when his portfolio fell ₹2.5 lakhs in two days. Influenced by WhatsApp panic, he sold at the bottom and locked in losses he could have recovered within six months.

The Herd Mentality Trap

Indians are particularly susceptible to social proof bias. When neighbours, relatives, and Telegram groups scream “sell everything,” we follow blindly. This collective panic creates crashes. During the 2024 election result volatility, the Nifty dropped 6% intraday before recovering fully within two sessions, yet lakhs of retail investors had already exited.

The Numbers Don’t Lie

Research shows investors who panic sold during the 2020 COVID crash missed the 75% Nifty 50 rally between March 2020 and February 2021. A SEBI study found 95% of individual F&O traders lost money between FY19 and FY22 due to emotional decisions. Despite crashes, the Sensex has delivered 12-15% CAGR over 20 years, with every major fall followed by new highs within one to three years.

Understanding Recency Bias

We give disproportionate weight to recent events. A single bad week erases memories of two good years. This recency bias makes us forget that markets are cyclical. Adani Group’s 2023 crash made investors dump all Adani stocks, but those who held Adani Ports recovered fully within eight months.

How to Protect Yourself

  • Build a Financial Cushion: Keep 6–12 months of expenses in liquid funds or savings accounts to avoid selling investments during stress. 
  • Avoid Constant Monitoring: Daily portfolio checks increase anxiety. Priya Sharma reviews investments quarterly, improving returns 12% annually. 
  • Set Rules, Not Emotions: Decide timelines in advance. For goals 15 years away, short-term drops are irrelevant. SIPs buy more units during falls through rupee cost averaging. 
  • Diversify Beyond Headlines: Avoid exposure to trending sectors. Spread across large caps, debt, gold, and international funds. In 2022, diversified portfolios fell 12–15% despite IT crashing. 
  • Use Stop Loss Wisely: Set a 20–25% stop loss for individual stocks. Avoid stop losses for long-term mutual funds meant for staying invested. 
  • Question the News Cycle: Media amplifies fear. A 500-point Sensex fall is only 0.6%. Focus on percentages and context, not headlines.
  • Remember Your ‘Why’: Write down investment goals and review them during panic. Short-term noise should not derail long-term wealth creation.

The Contrarian Advantage

Successful investors like Rakesh Jhunjhunwala bought during the 2008 crash when others were selling. History shows wealth is created by those who buy during panic. As retail investors sold ₹40,000 crores in March 2020, smart money accumulated quality stocks. The market rewards patience over panic. As Warren Buffett said, markets transfer money from the impatient to the patient. Your biggest enemy is often yourself.

Frequently Asked Questions

  1. Why do investors panic sell during market crashes?
    Panic selling happens when fear and loss aversion take over, causing investors to react emotionally to falling prices.
  2. What is herd mentality in investing?
    Herd mentality occurs when investors follow others’ actions, like friends, social media, or news—without doing their own analysis.
  3. How does panic selling affect long-term returns?
    Selling during market declines locks in losses and can make investors miss the recovery that often follows.
  4. How can investors avoid panic selling?
    Investors can avoid panic selling by focusing on long-term goals, diversifying their portfolio, and avoiding constant market monitoring.